0. 시작하며
이번에는 시스템의 상태를 실시간으로 확인하고 문제를 해결하는 모니터링과 로깅에 활용되는 기술인 Prometheus, Grafana를 실습해보는 시간을 가졌다. 시스템 유지보수에 핵심이 되는 기술이라 생각하여 이번 주차의 스터디 주제로 잡기로 했다.
우선 시작하기 전에 Prometheus와 Grafana 파일을 다운로드 받아 진행하는 형식으로 실습을 진행하였다.
1. Spring Boot 애플리케이션 Actuator & Metrics 설정
Spring Boot 애플리케이션 내부 상태(JVM 메모리, CPU, HTTP 요청 수 등)를 메트릭 형태로 수집하기 위해 Actuator와 Micrometer Prometheus 라이브러리를 추가한다.
1-1) 의존성(Dependencies) 추가
Gradle(build.gradle) 파일이다.
dependencies {
    // Spring Boot Actuator
    implementation 'org.springframework.boot:spring-boot-starter-actuator'
    // Prometheus 메트릭 포맷으로 변환해주는 Micrometer 레지스트리
    implementation 'io.micrometer:micrometer-registry-prometheus'
}Maven(pom.xml) 파일이다.
<dependencies>
    <dependency>
        <groupId>org.springframework.boot</groupId>
        <artifactId>spring-boot-starter-actuator</artifactId>
    </dependency>
    <dependency>
        <groupId>io.micrometer</groupId>
        <artifactId>micrometer-registry-prometheus</artifactId>
    </dependency>
</dependencies>
1-2) application.yml 파일 설정
spring:
  application:
    name: api-server

management:
  endpoints:
    web:
      exposure:
        include: health, info, metrics, prometheus # Actuator 엔드포인트 노출
  endpoint:
    health:
      show-details: always
    prometheus:
      enabled: true
  metrics:
    tags:
      application: ${spring.application.name} # Grafana에서 앱 식별용 태그
1-3) 애플리케이션 실행 및 엔드포인트 검증
애플리케이션을 실행 후 웹 브라우저 또는 curl로 프로메테우스 포맷 메트릭 출력을 확인한다.
curl 명령어는 아래와 같다.
curl http://localhost:8080/actuator/prometheus출력 예시는 아래와 같다.
# HELP jvm_memory_used_bytes The amount of used memory
# TYPE jvm_memory_used_bytes gauge
jvm_memory_used_bytes{area="heap",id="G1 Survivor Space",} 2097152.0
process_cpu_usage 0.015432
http_server_requests_seconds_count{exception="None",method="GET",outcome="SUCCESS",status="200",uri="/api/v1/test"} 12.0
1-4) Spring Boot 앱의 Kubernetes Manifest (app-deployment.yaml)
Prometheus가 Kubernetes Pod를 자동으로 탐지(Service Discovery)할 수 있도록 Pod Template Annotations를 설정해준다.
apiVersion: apps/v1
kind: Deployment
metadata:
  name: api-server
  labels:
    app: api-server
spec:
  replicas: 2
  selector:
    matchLabels:
      app: api-server
  template:
    metadata:
      labels:
        app: api-server
      annotations: # 📌 Prometheus가 Scraping할 정보를 Annotation으로 선언
        prometheus.io/scrape: "true"
        prometheus.io/path: "/actuator/prometheus"
        prometheus.io/port: "8080"
    spec:
      containers:
      - name: api-server
        image: myregistry/api-server:v1.0 # 본인의 Docker 이미지 명
        ports:
        - containerPort: 8080
---
apiVersion: v1
kind: Service
metadata:
  name: api-server-service
spec:
  type: ClusterIP
  selector:
    app: api-server
  ports:
  - port: 8080
    targetPort: 8080
1-5) 실습 화면
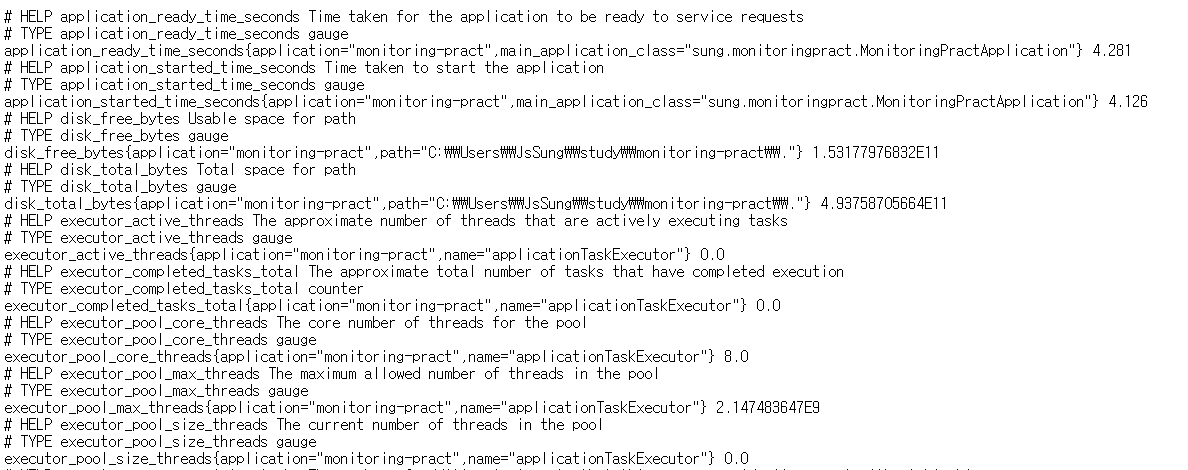
애플리케이션을 실행하고, 브라우저에 접속해보니 아래와 같은 화면이 나왔다.
처음에는 이상한 줄 알았는데, 프로메테우스 표준 포맷이 맞다고 한다.
2. Kubernetes 내 Prometheus 배포 및 Scraping 설정
Prometheus는 Target 시스템의 메트릭 엔드포인트를 주기적으로 호출하여 시계열 데이터(Time Series Data)를 수집(Pull)한다.
2-1) 네임스페이스 및 RBAC 권한 생성 (prometheus-rbac.yaml)
Prometheus가 Kubernetes API Server에 조회하여 Pod 목록을 수집할 수 있는 권한을 부여한다.
apiVersion: v1
kind: Namespace
metadata:
  name: monitoring
---
apiVersion: v1
kind: ServiceAccount
metadata:
  name: prometheus
  namespace: monitoring
---
apiVersion: rbac.authorization.k8s.io/v1
kind: ClusterRole
metadata:
  name: prometheus
rules:
- apiGroups: [""]
  resources: ["nodes", "nodes/proxy", "services", "endpoints", "pods"]
  verbs: ["get", "list", "watch"]
- apiGroups: ["extensions"]
  resources: ["ingresses"]
  verbs: ["get", "list", "watch"]
- nonResourceURLs: ["/metrics"]
  verbs: ["get"]
---
apiVersion: rbac.authorization.k8s.io/v1
kind: ClusterRoleBinding
metadata:
  name: prometheus
roleRef:
  apiGroup: rbac.authorization.k8s.io
  kind: ClusterRole
  name: prometheus
subjects:
- kind: ServiceAccount
  name: prometheus
  namespace: monitoring
2-2) Prometheus ConfigMap 설정 (prometheus-configmap.yaml)
Pod의 Annotation(prometheus.io/scrape: "true")을 자동으로 탐지하도록 kubernetes-sd-configs 탐지 규칙을 작성한다.
apiVersion: v1
kind: ConfigMap
metadata:
  name: prometheus-server-conf
  namespace: monitoring
data:
  prometheus.yml: |
    global:
      scrape_interval: 15s
      evaluation_interval: 15s

    scrape_configs:
      # 1. Prometheus 자체 메트릭 수집
      - job_name: 'prometheus'
        static_configs:
          - targets: ['localhost:9090']

      # 2. Kubernetes Pods 자동 탐지 (Spring Boot App Scraping)
      - job_name: 'kubernetes-pods'
        kubernetes_sd_configs:
          - role: pod
        relabel_configs:
          # prometheus.io/scrape=true 어노테이션이 있는 Pod만 수집
          - source_labels: [__meta_kubernetes_pod_annotation_prometheus_io_scrape]
            action: keep
            regex: true
          # prometheus.io/path 어노테이션 값을 metrics_path로 사용 (기본값: /actuator/prometheus)
          - source_labels: [__meta_kubernetes_pod_annotation_prometheus_io_path]
            action: replace
            target_label: __metrics_path__
            regex: (.+)
          # prometheus.io/port 어노테이션 포트로 변경
          - source_labels: [address, __meta_kubernetes_pod_annotation_prometheus_io_port]
            action: replace
            regex: ([^:]+)(?::\d+)?;(\d+)
            replacement: $1:$2
            target_label: __address__
          # Pod 라벨/네임스페이스 정보를 메트릭 라벨로 저장
          - action: labelmap
            regex: __meta_kubernetes_pod_label_(.+)
          - source_labels: [__meta_kubernetes_namespace]
            action: replace
            target_label: kubernetes_namespace
          - source_labels: [__meta_kubernetes_pod_name]
            action: replace
            target_label: kubernetes_pod_name
2-3) Prometheus Deployment & Service (prometheus-deployment.yaml)
apiVersion: apps/v1
kind: Deployment
metadata:
  name: prometheus-deployment
  namespace: monitoring
spec:
  replicas: 1
  selector:
    matchLabels:
      app: prometheus-server
  template:
    metadata:
      labels:
        app: prometheus-server
    spec:
      serviceAccountName: prometheus
      containers:
        - name: prometheus
          image: prom/prometheus:v2.48.1
          args:
            - "--config.file=/etc/prometheus/prometheus.yml"
            - "--storage.tsdb.path=/prometheus/"
          ports:
            - containerPort: 9090
          volumeMounts:
            - name: prometheus-config-volume
              mountPath: /etc/prometheus/
            - name: prometheus-storage-volume
              mountPath: /prometheus/
      volumes:
        - name: prometheus-config-volume
          configMap:
            defaultMode: 420
            name: prometheus-server-conf
        - name: prometheus-storage-volume
          emptyDir: {}
---
apiVersion: v1
kind: Service
metadata:
  name: prometheus-service
  namespace: monitoring
spec:
  type: NodePort
  ports:
    - port: 9090
      targetPort: 9090
      nodePort: 30090
  selector:
    app: prometheus-server
2-4) 배포 명령 및 동작 검증
아래의 명령어들로 배포를 실시한다.
kubectl apply -f prometheus-rbac.yaml
kubectl apply -f prometheus-configmap.yaml
kubectl apply -f prometheus-deployment.yaml
그리고, 아래의 3단계를 거쳐서 검증을 진행한다.
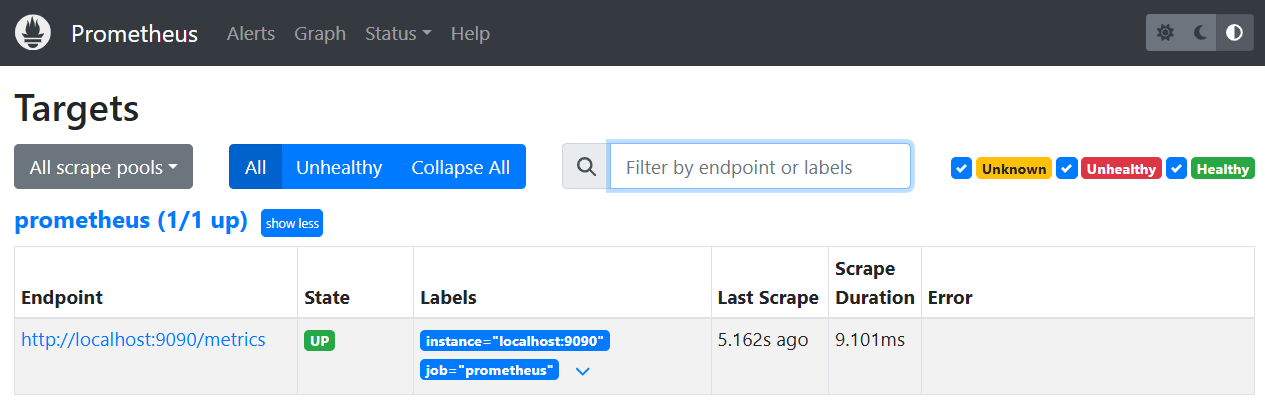
실제로 Prometheus를 실행시켜서 State가 UP으로 정상적으로 나오는지 확인했다.
3. Grafana 배포 및 대시보드 시각화
Prometheus 시계열 데이터를 시각화하고 대시보드로 구서아기 위해 Grafana를 배포한다.
3-1) Grafana Deployment & Service (grafana.yaml)
apiVersion: apps/v1
kind: Deployment
metadata:
  name: grafana
  namespace: monitoring
spec:
  replicas: 1
  selector:
    matchLabels:
      app: grafana
  template:
    metadata:
      labels:
        app: grafana
    spec:
      containers:
      - name: grafana
        image: grafana/grafana:10.1.4
        ports:
        - containerPort: 3000
        env:
        - name: GF_SECURITY_ADMIN_PASSWORD
          value: "admin1234" # Grafana 관리자 비밀번호
---
apiVersion: v1
kind: Service
metadata:
  name: grafana-service
  namespace: monitoring
spec:
  type: NodePort
  ports:
  - port: 3000
    targetPort: 3000
    nodePort: 30300
  selector:
    app: grafana
3-2) Grafana 접속 및 Prometheus 데이터 소스 연결
- Port-Forward 또는 NodePort로 Grafana 웹UI 접속 (http://localhost:30300 또는 http://localhost:3000)
- 로그인: ID admin / PW admin1234
- Connections > Data Sources > Add data source 클릭
- Prometheus 선택
- Prometheus server URL 입력: http://prometheus-service.monitoring.svc.cluster.local:9090 (K8s 내부 DNS주소)
- Save & test 클릭하여 Data source is working 메시지 확인
3-3) 대시보드 생성 및 주요 PromQL 쿼리 작성
Grafana에서 Dashboards > New > New Dashboard > Add visualization을 눌러 메트릭 차트를 새로 생성한다.
📊 주요 API 서버 모니터링 PromQL 쿼리 모음
| API 트래픽 (RPS / TPS) | sum(rate(http_server_requests_seconds_count[1m])) | 초당 처리 중인 HTTP 요청 수 |
| 평균 API 응답 속도 (Latency) | sum(rate(http_server_requests_seconds_sum[1m])) / sum(rate(http_server_requests_seconds_count[1m])) | 평균 HTTP 응답 지연 시간(초) |
| 95% 사용자 응답 속도 | histogram_quantile(0.95, sum(rate(http_server_requests_seconds_bucket[5m])) by (le)) | 상위 95% 사용자가 경험하는 지연 시간 |
| HTTP 5xx 에러율 (%) | (sum(rate(http_server_requests_seconds_count{status=~"5.."}[5m])) / sum(rate(http_server_requests_seconds_count[5m]))) * 100 | 서버 내부 에러 비율 |
| JVM Heap Memory 사용량 | jvm_memory_used_bytes{area="heap"} | JVM 힙 메모리 사용량 (Bytes) |
| Process CPU 사용률 | process_cpu_usage * 100 | Spring Boot 앱의 CPU 사용률 (%) |
3-4) 실습
Grafana-server.exe를 실행시키면 이런 창이 뜬다.
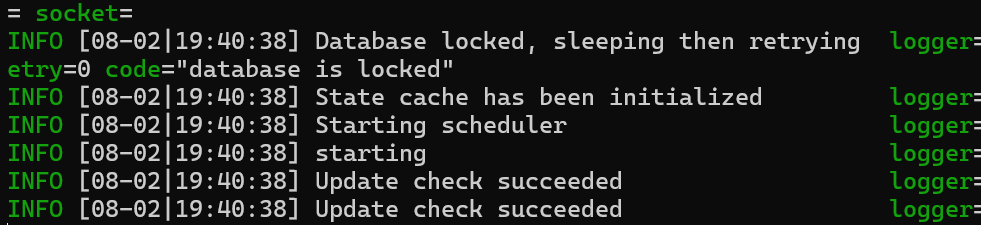
이후에 브라우저에 접속하여 Grafana에서 Prometheus 데이터 소스를 연결해주었다.
JVM 전용 대시보드를 import하여 가져온 후에 확인해보니 아래의 화면과 같이 나타났다.

4. 실습 검증 및 부하 테스트
모니터링 대시보드가 정상 동작하는지 테스트용 트래픽을 유발하여 확인하려 한다.
하지만, 아무리 트래픽을 보내봐도 Grafana의 변동이 없었다. 그래서, Prometheus가 데이터를 잘 수집하고 있는지부터 확인하였다.
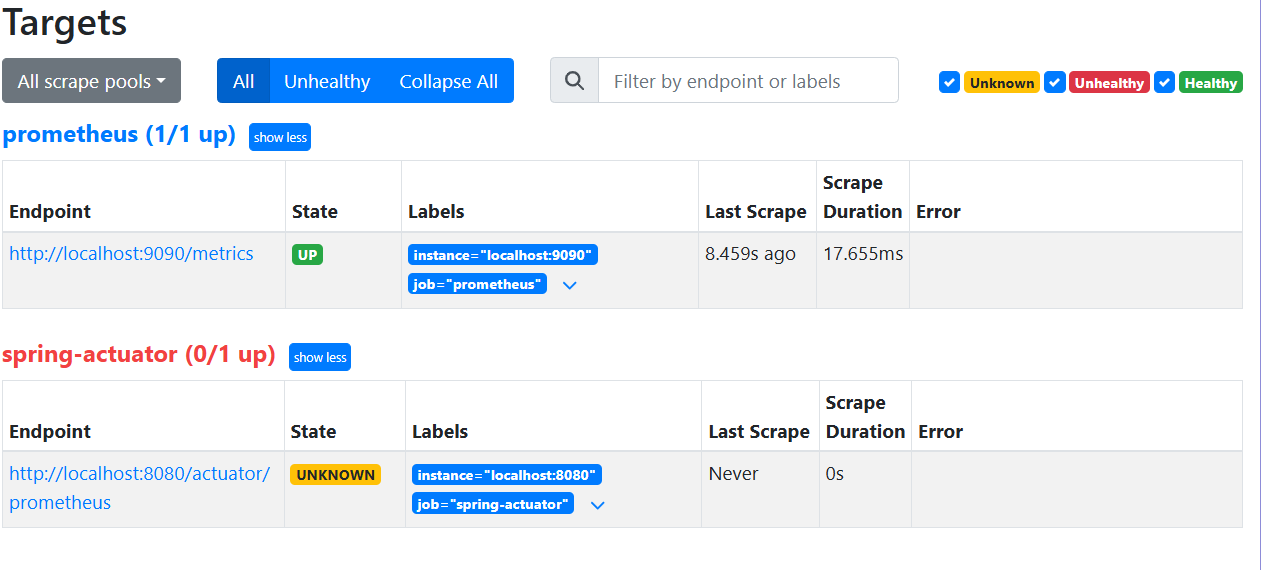
화면에서 보이듯 spring-actuator의 State가 UP이 아닌 UNKNOWN으로 나와 문제가 있던 것이다.

약 10초 정도 기다리다가, 이후에 새로고침을 누르니 UP으로 상태가 변했다.
다시 트래픽을 발생시켰더니, Grafana에서 아래와 같이 수치가 변동된 것을 확인할 수 있었다.
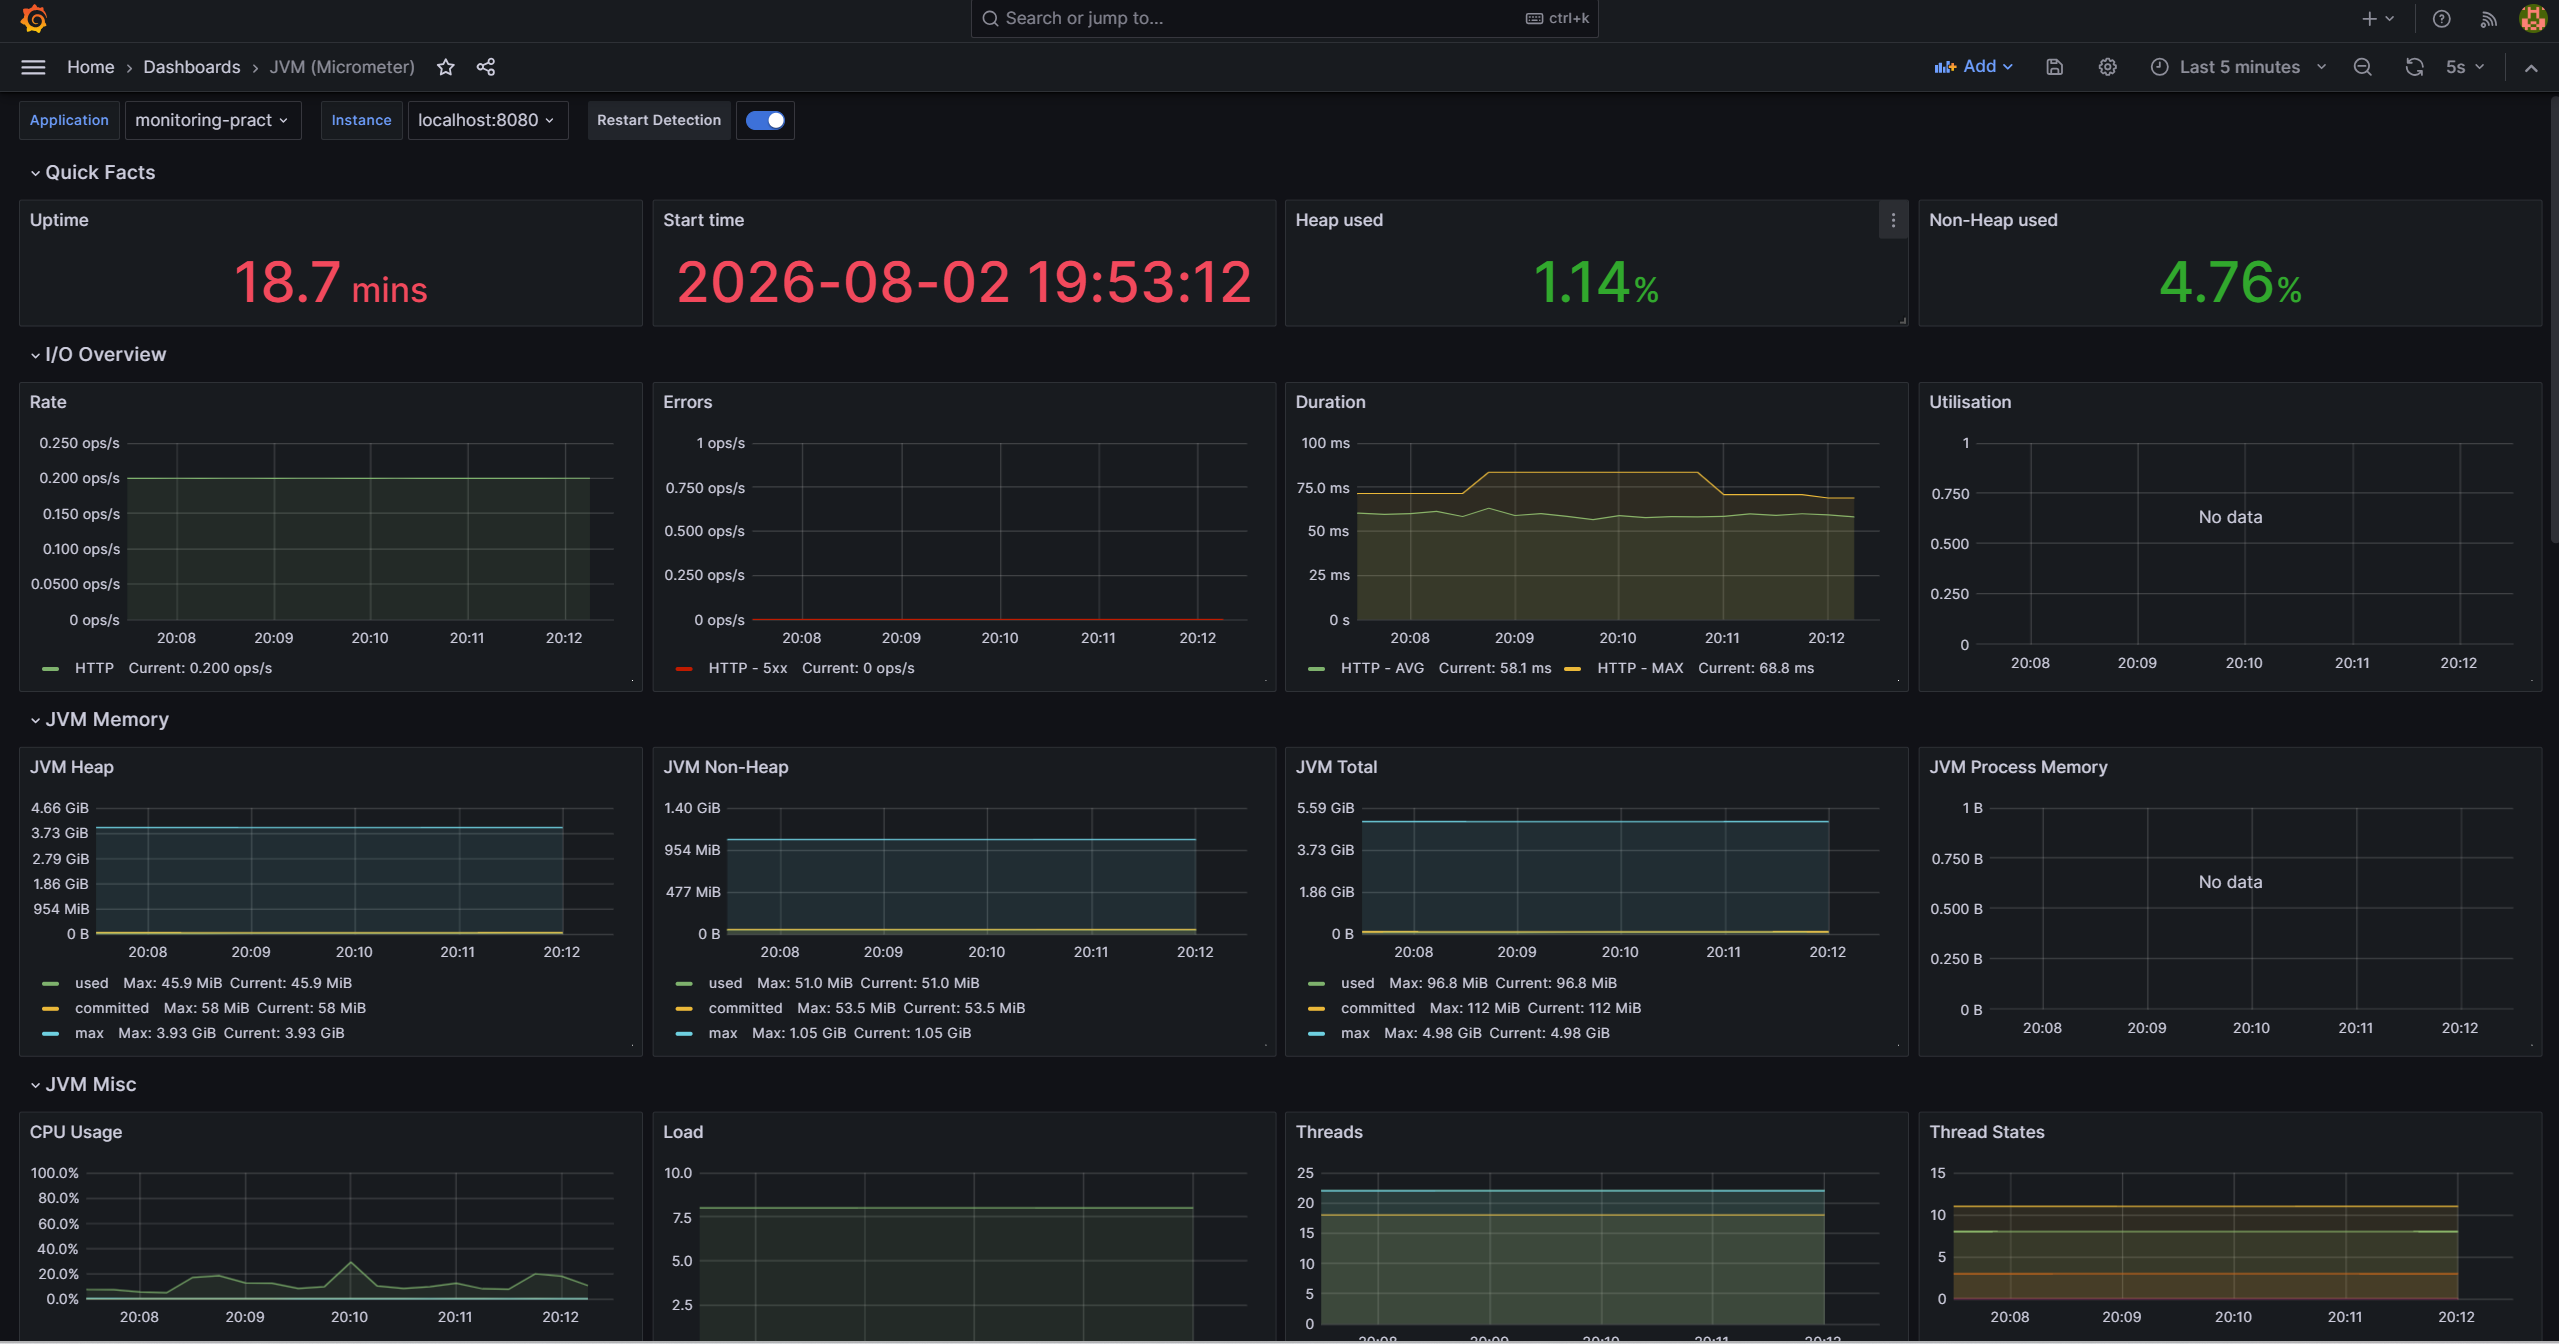
4-1) JVM Memory Heap (힙 메모리)
- 분석: 19:55~20:09 구간을 보면 메모리 그래프가 톱니바퀴 형태로 상하로 요동치고 있다.
- 의미: 전송한 반복 트래픽으로 인해 객체가 메모리에 계속 생성되었다가, JVM의 가비지 콜렉터가 수거하여 상하로 움직이는 과정이 실시간으로 관측된 것이다.
4-2) CPU Usage (CPU 사용량)
- 분석: 19:55 이후 시스템 및 프로세스 CPU 그래프에 스파이크가 발생하며 움직였다.
- 의미: REST API 요청을 처리하기 위해 CPU 리소스가 사용되었음을 시각적으로 증명한다.
4-3) Garbage Collection (가비지 컬렉션 관제)
- 분석: G1 Young Generation GC가 트래픽 수집 주기마다 주기적으로 발생하며 지연시간과 횟수가 함께 기록되고 있다.
4-4) Threads & Classes (스레드 및 클래스 상태)
- 분석: Live Thread 22개, Daemon Thread 18개로 안정적인 스레드 수치를 유지하고 있으며, 로딩된 클래스 수(8.82 K)도 일정하게 관리되고 있다.
4-5) Uptime & Start Time
- 분석: 현재 Spring Boot 서버거 18.7분동안 한 번도 다운되지 않고 안정적으로 서비스 중임을 보여준다.
5.마무리하며
이번 기회를 통해 정말 낯선 Prometheus와 Grafana를 사용해 대시보드로 모니터링하는 법을 확인했다.
이 한 번의 스터디로 모니터링 하는 법을 완벽히 파악했다고 하진 못할 것이다. 진행하면서도 굉장히 많은 부분에서 막혔었고, 어려움을 겪었었다. 더욱 더 경험하여 실제로 사용할 수 있는 수준까지 올려야겠다.
'[INFRA]' 카테고리의 다른 글
| NCP + Docker + GitHub Action으로 CI/CD를 구축해보기 (0) | 2026.07.30 |
|---|---|
| 프로젝트 배포 이해하기 (10) | 2025.08.10 |